How up-and-coming software developer qbilon GmbH optimizes IT landscape analysis with visual representation.
The transformation of IT landscapes from on-premises to cloud computing providers is a huge and urgent challenge. Many companies have reached a level of IT complexity that is no longer “manually manageable” – resulting in IT cost inefficiency, recurring outages, security leaks, and time-consuming maintenance. They desperately need help in keeping their systems safe and operational.
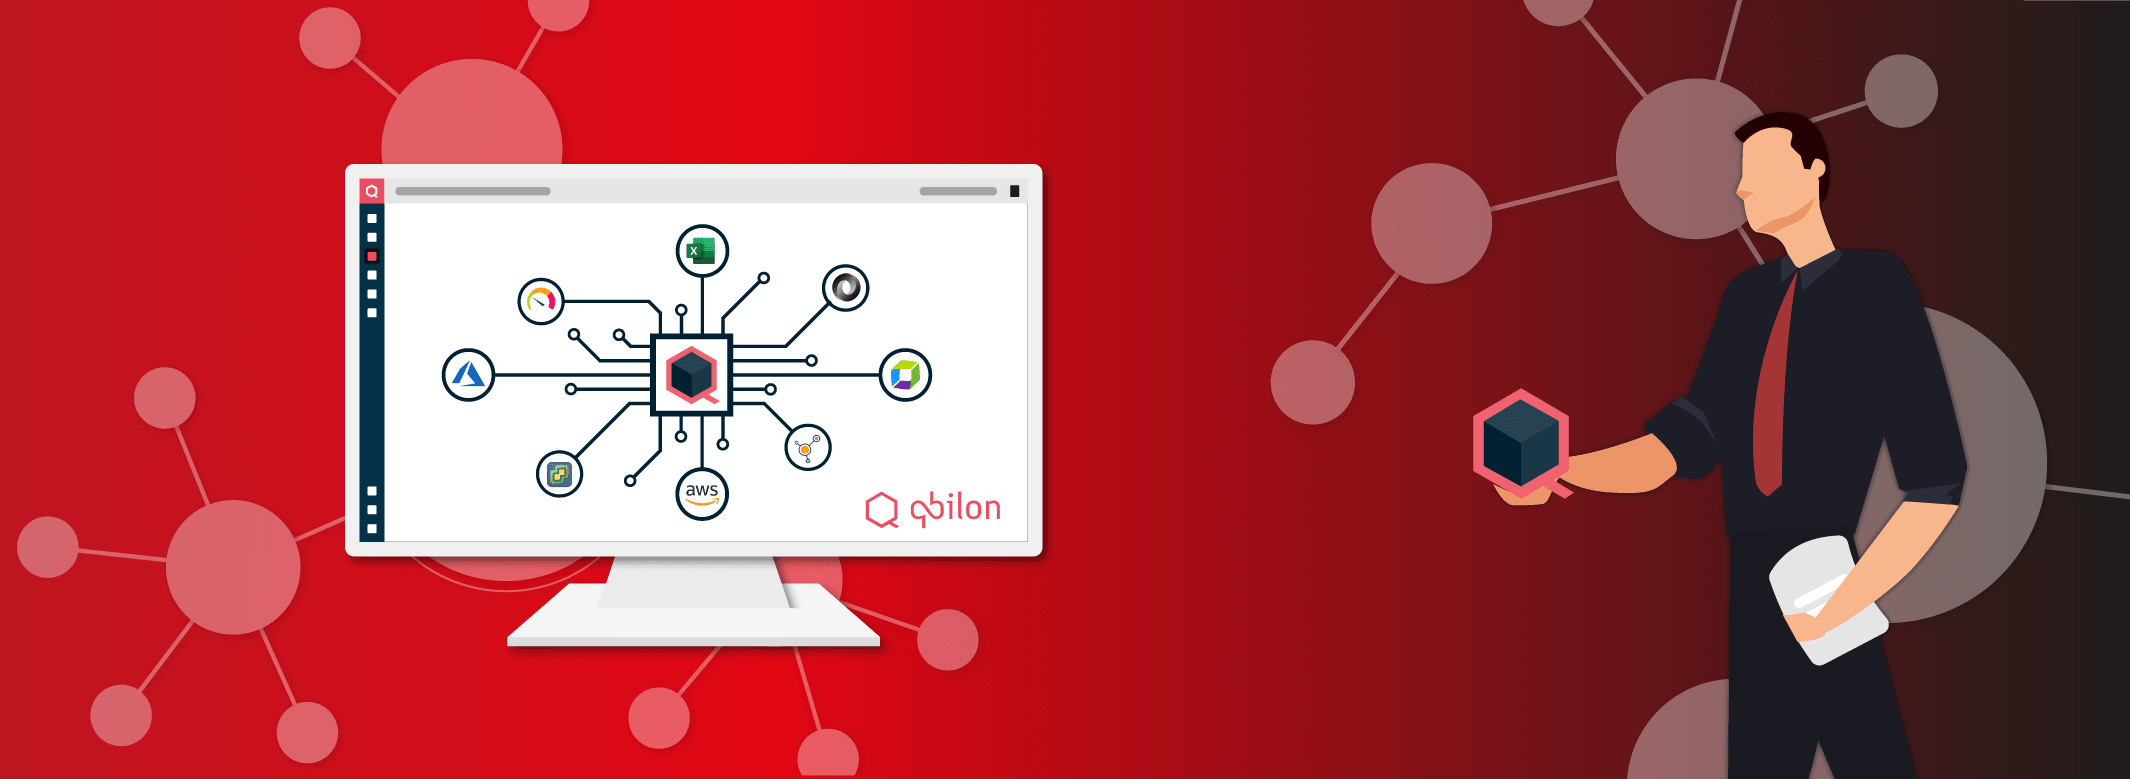
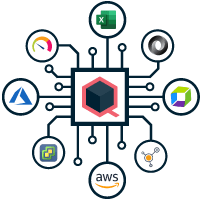
The German startup qbilon provides a platform for capturing, analyzing, and optimizing hybrid IT landscapes, enabling IT executives to make just such well-founded, future-proof IT decisions.
The startup has developed a tool to address the continuously growing requirements of companies. Their software merges previously isolated data sources into a coherent, consistent IT map. Companies can then use this map to create clear reports (e.g., for audits), identify cost drivers, and find security gaps and stability issues within their IT landscape.
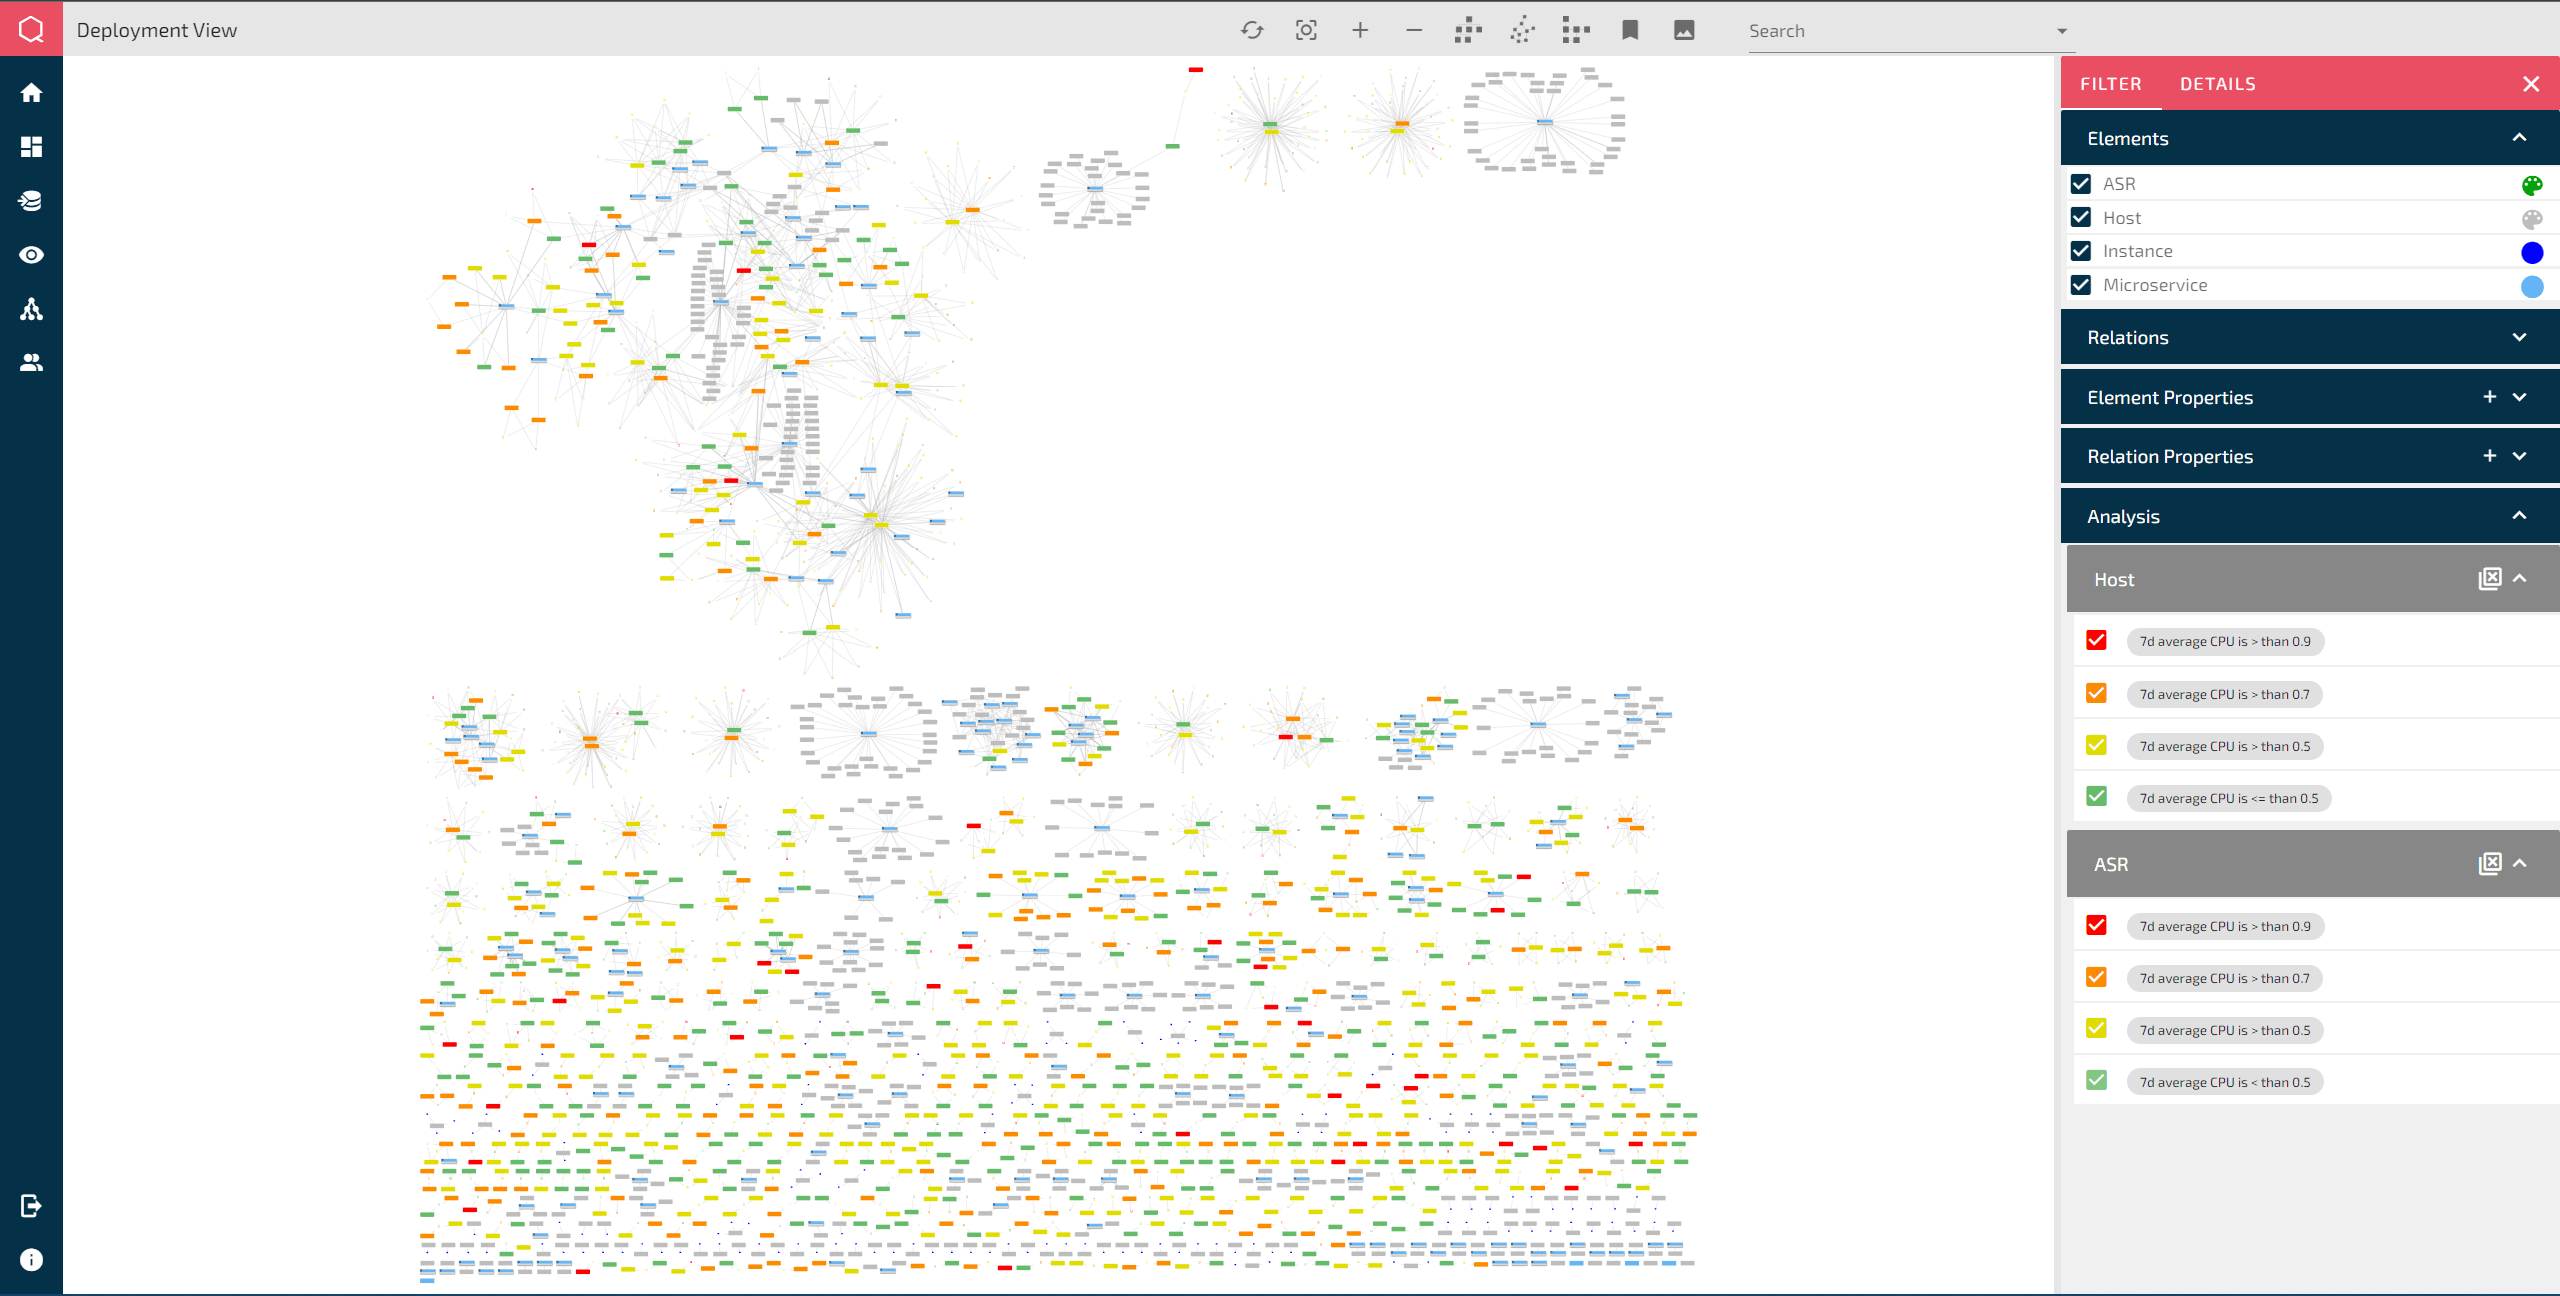
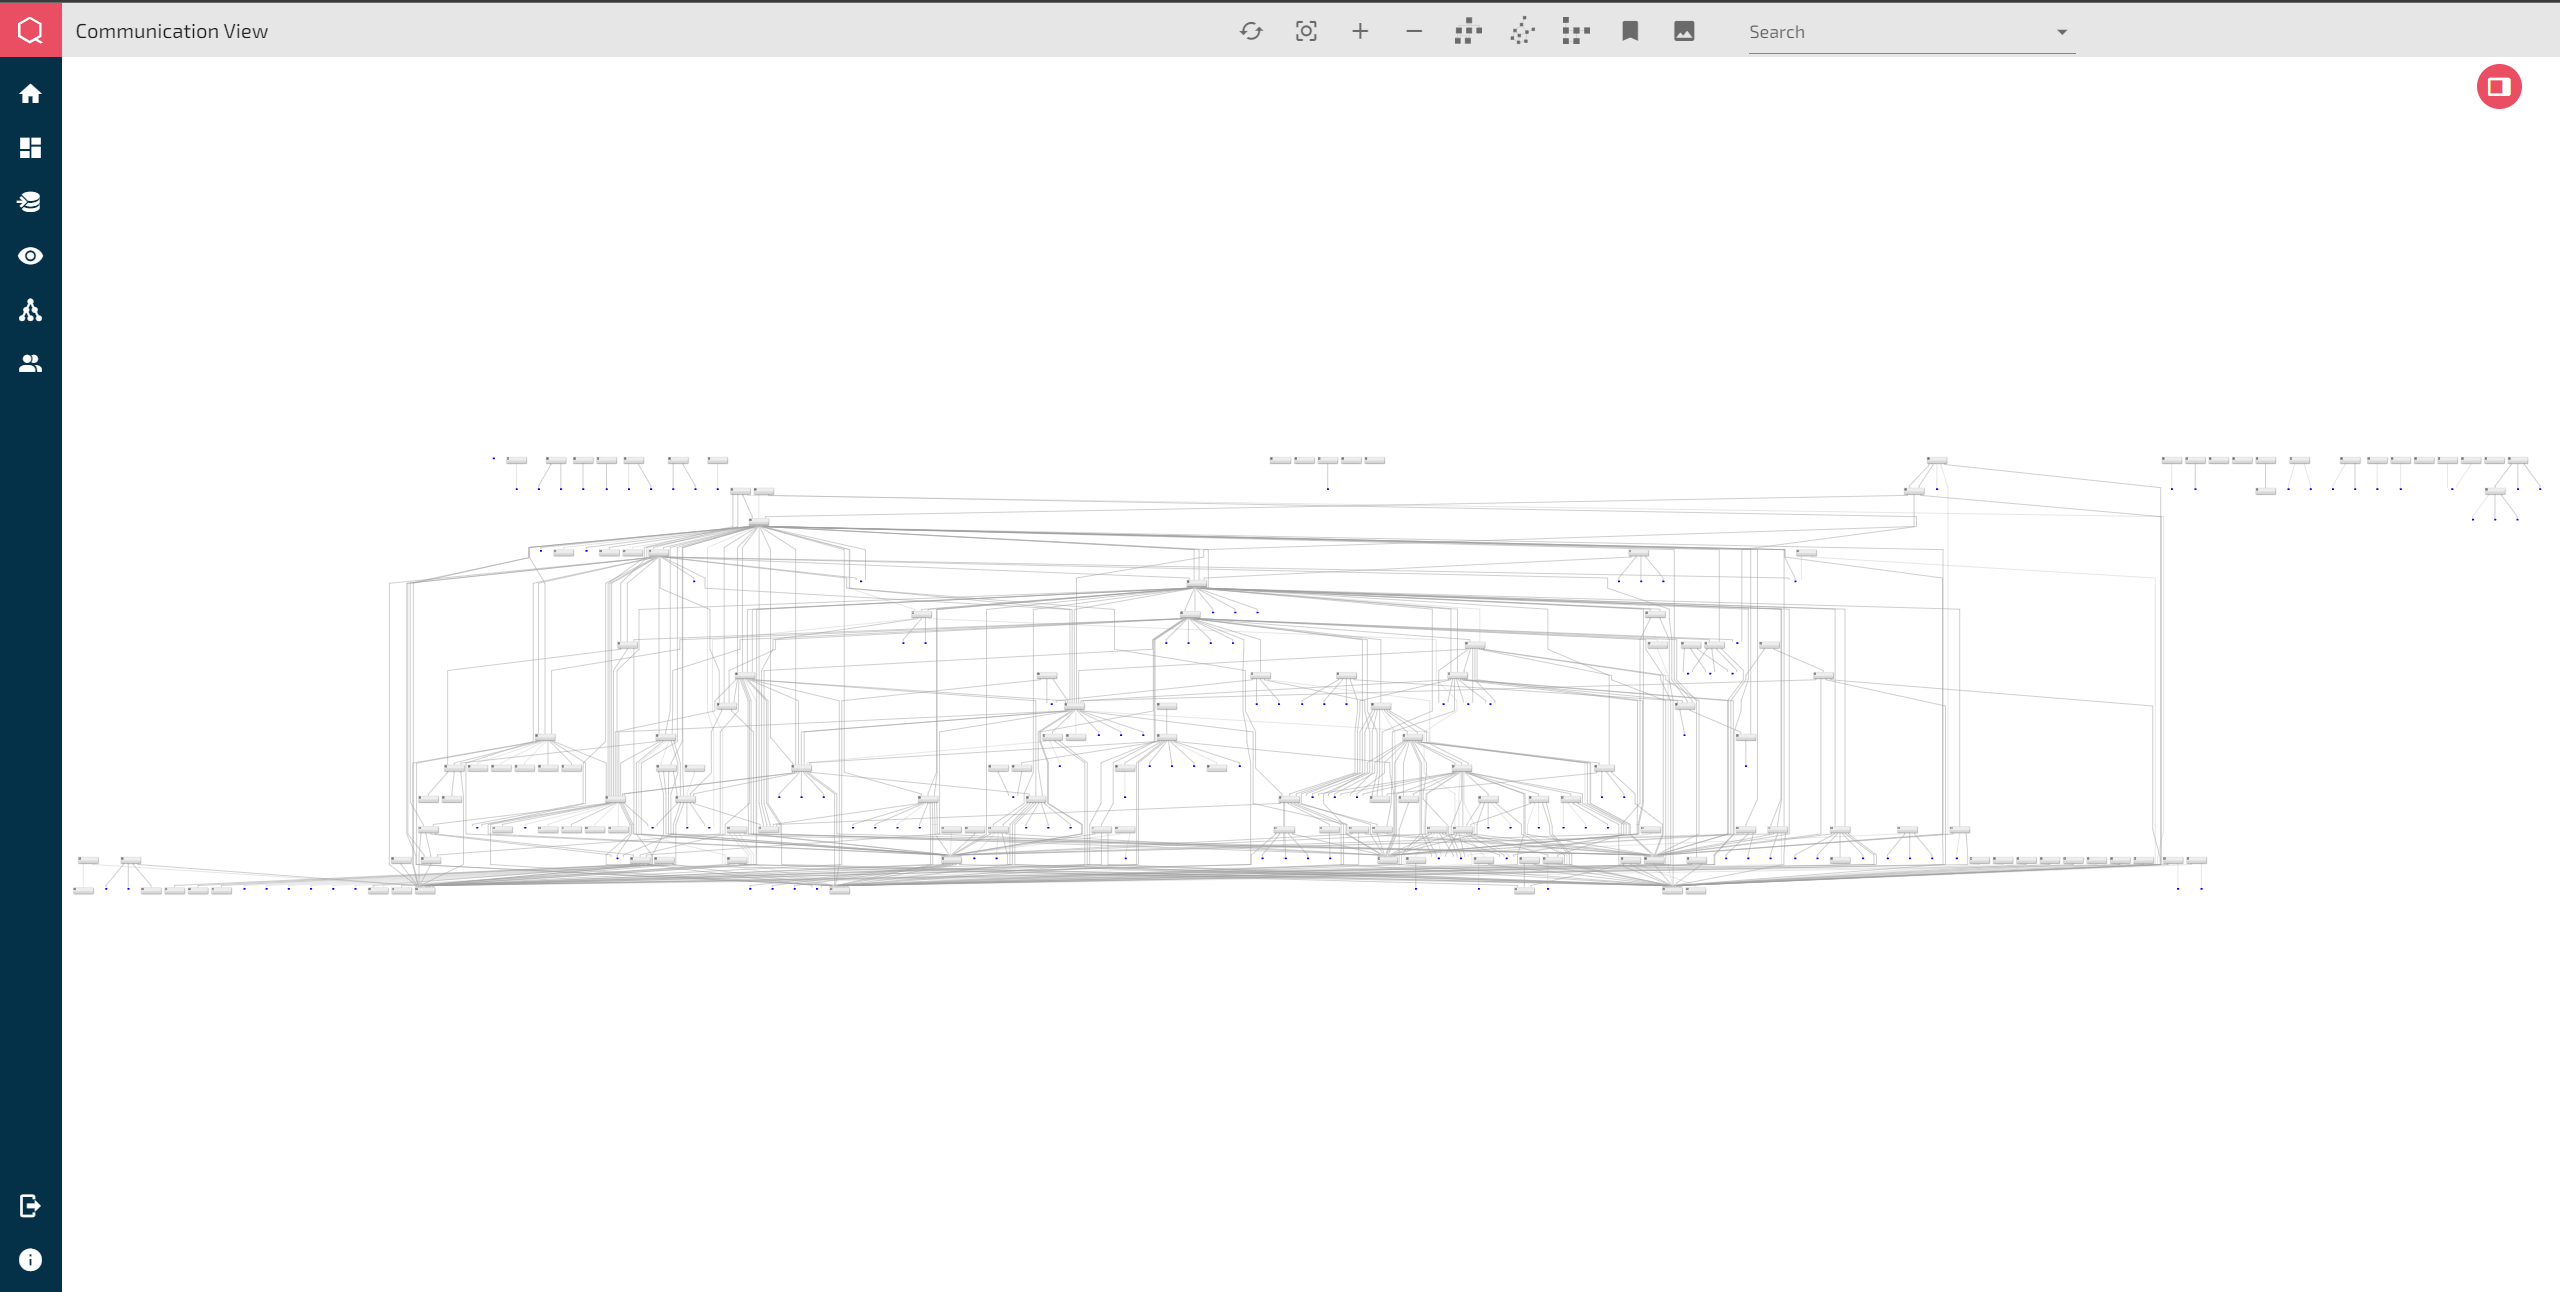
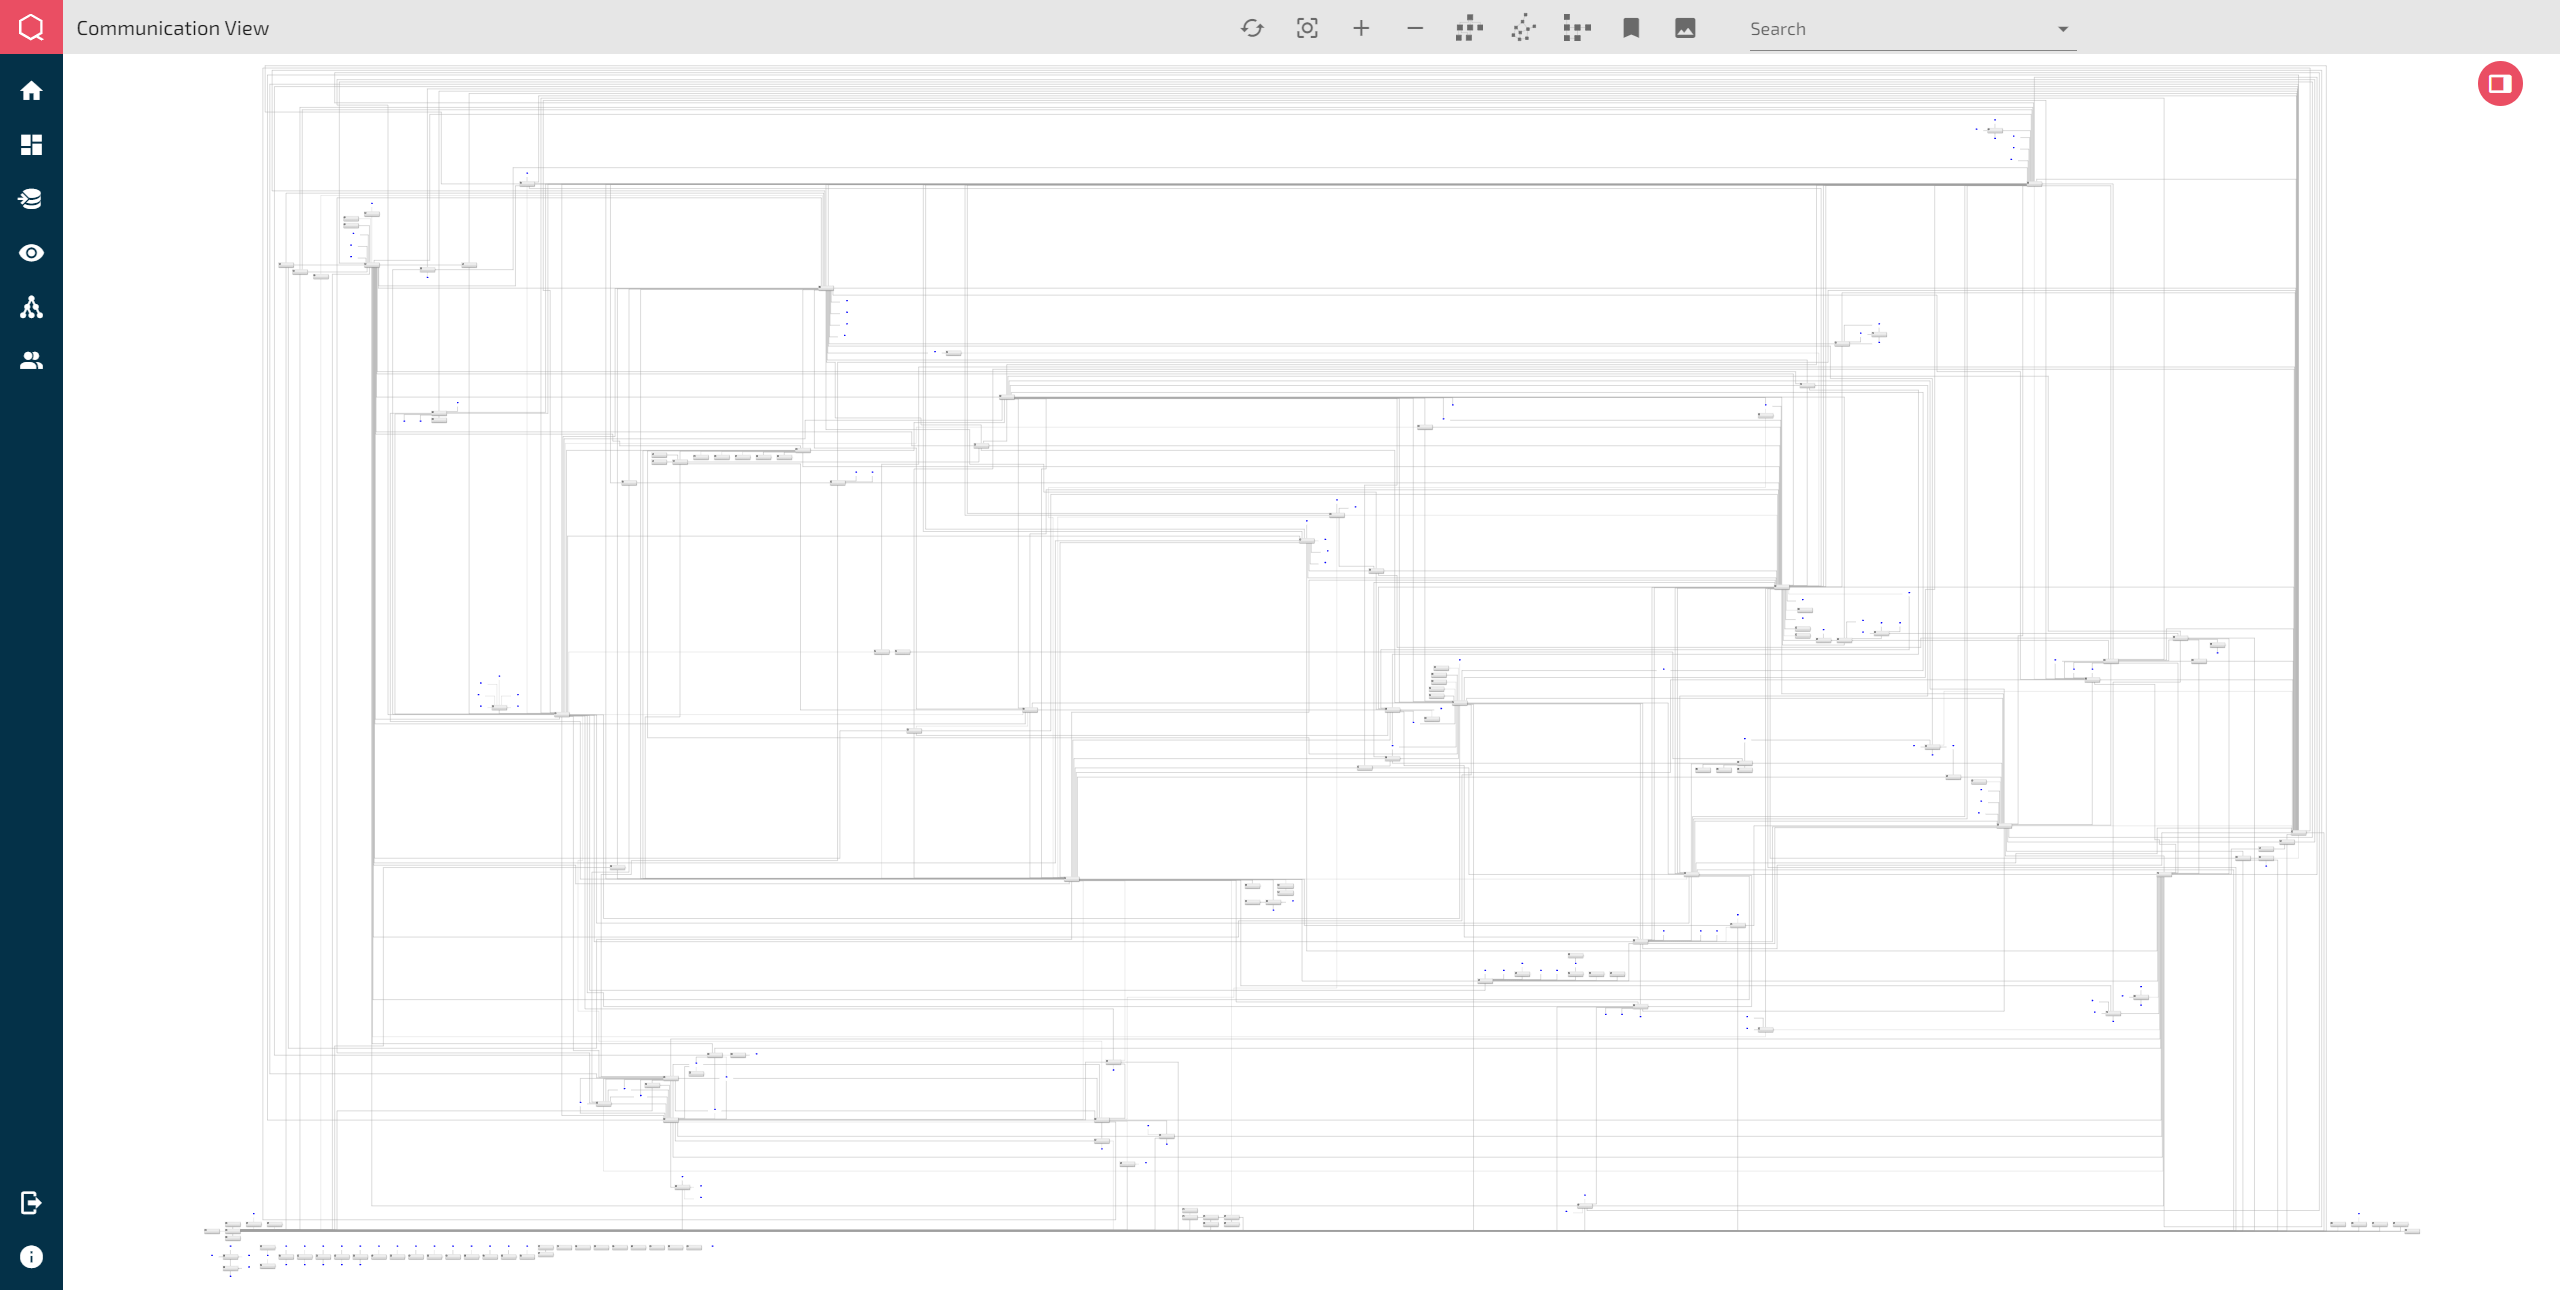
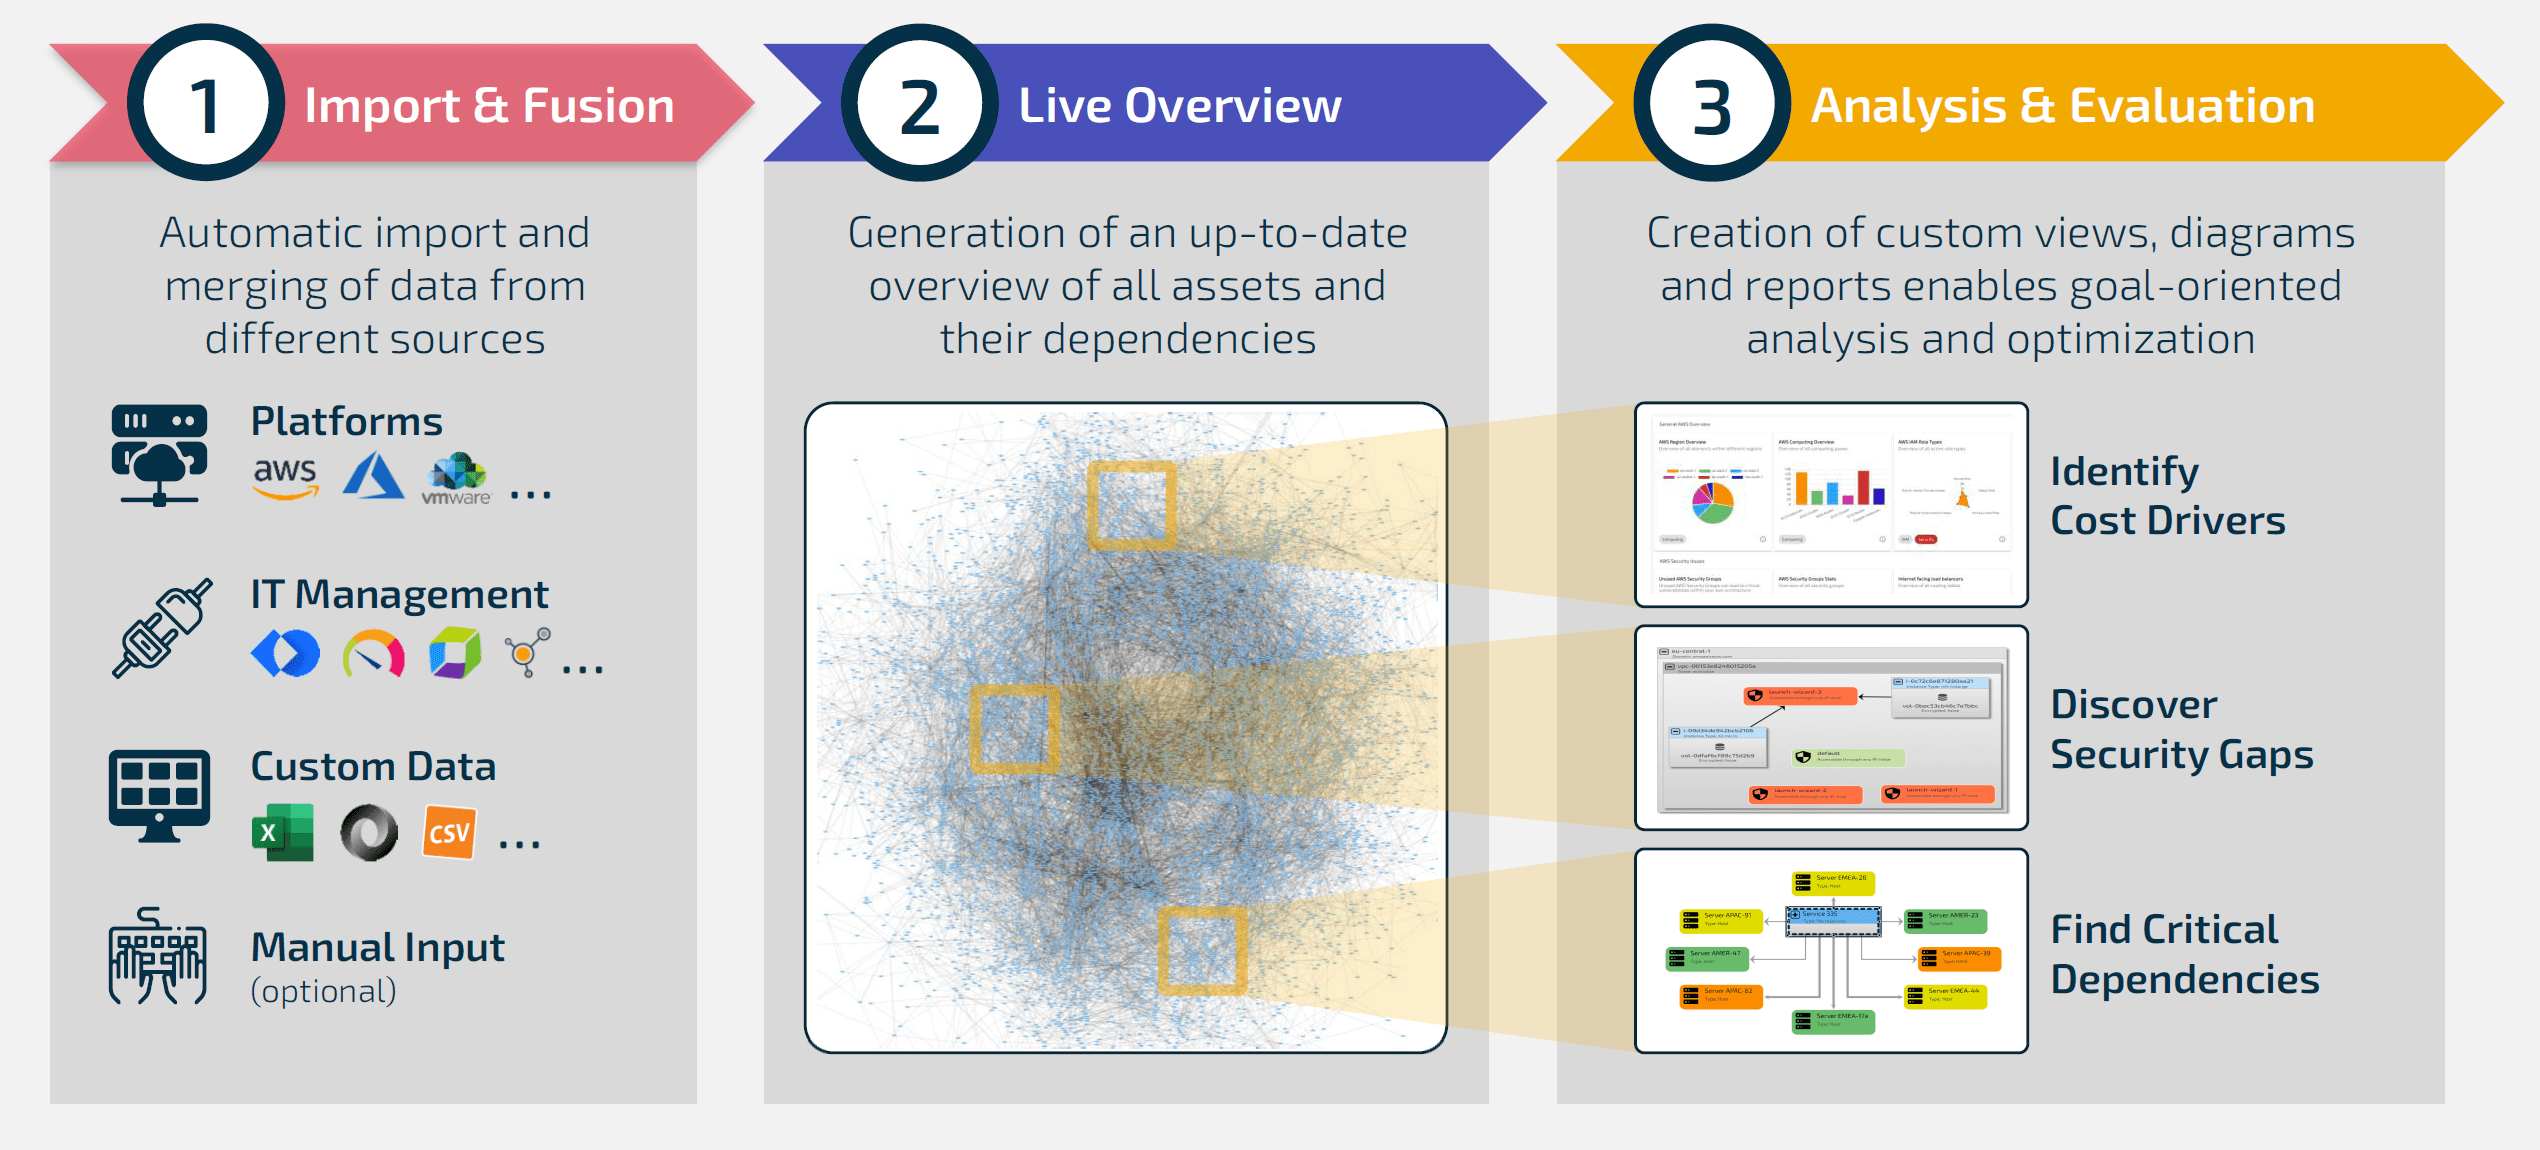 the tool qbilon shows overview of IT assets and dependencies (Source: qbilon)
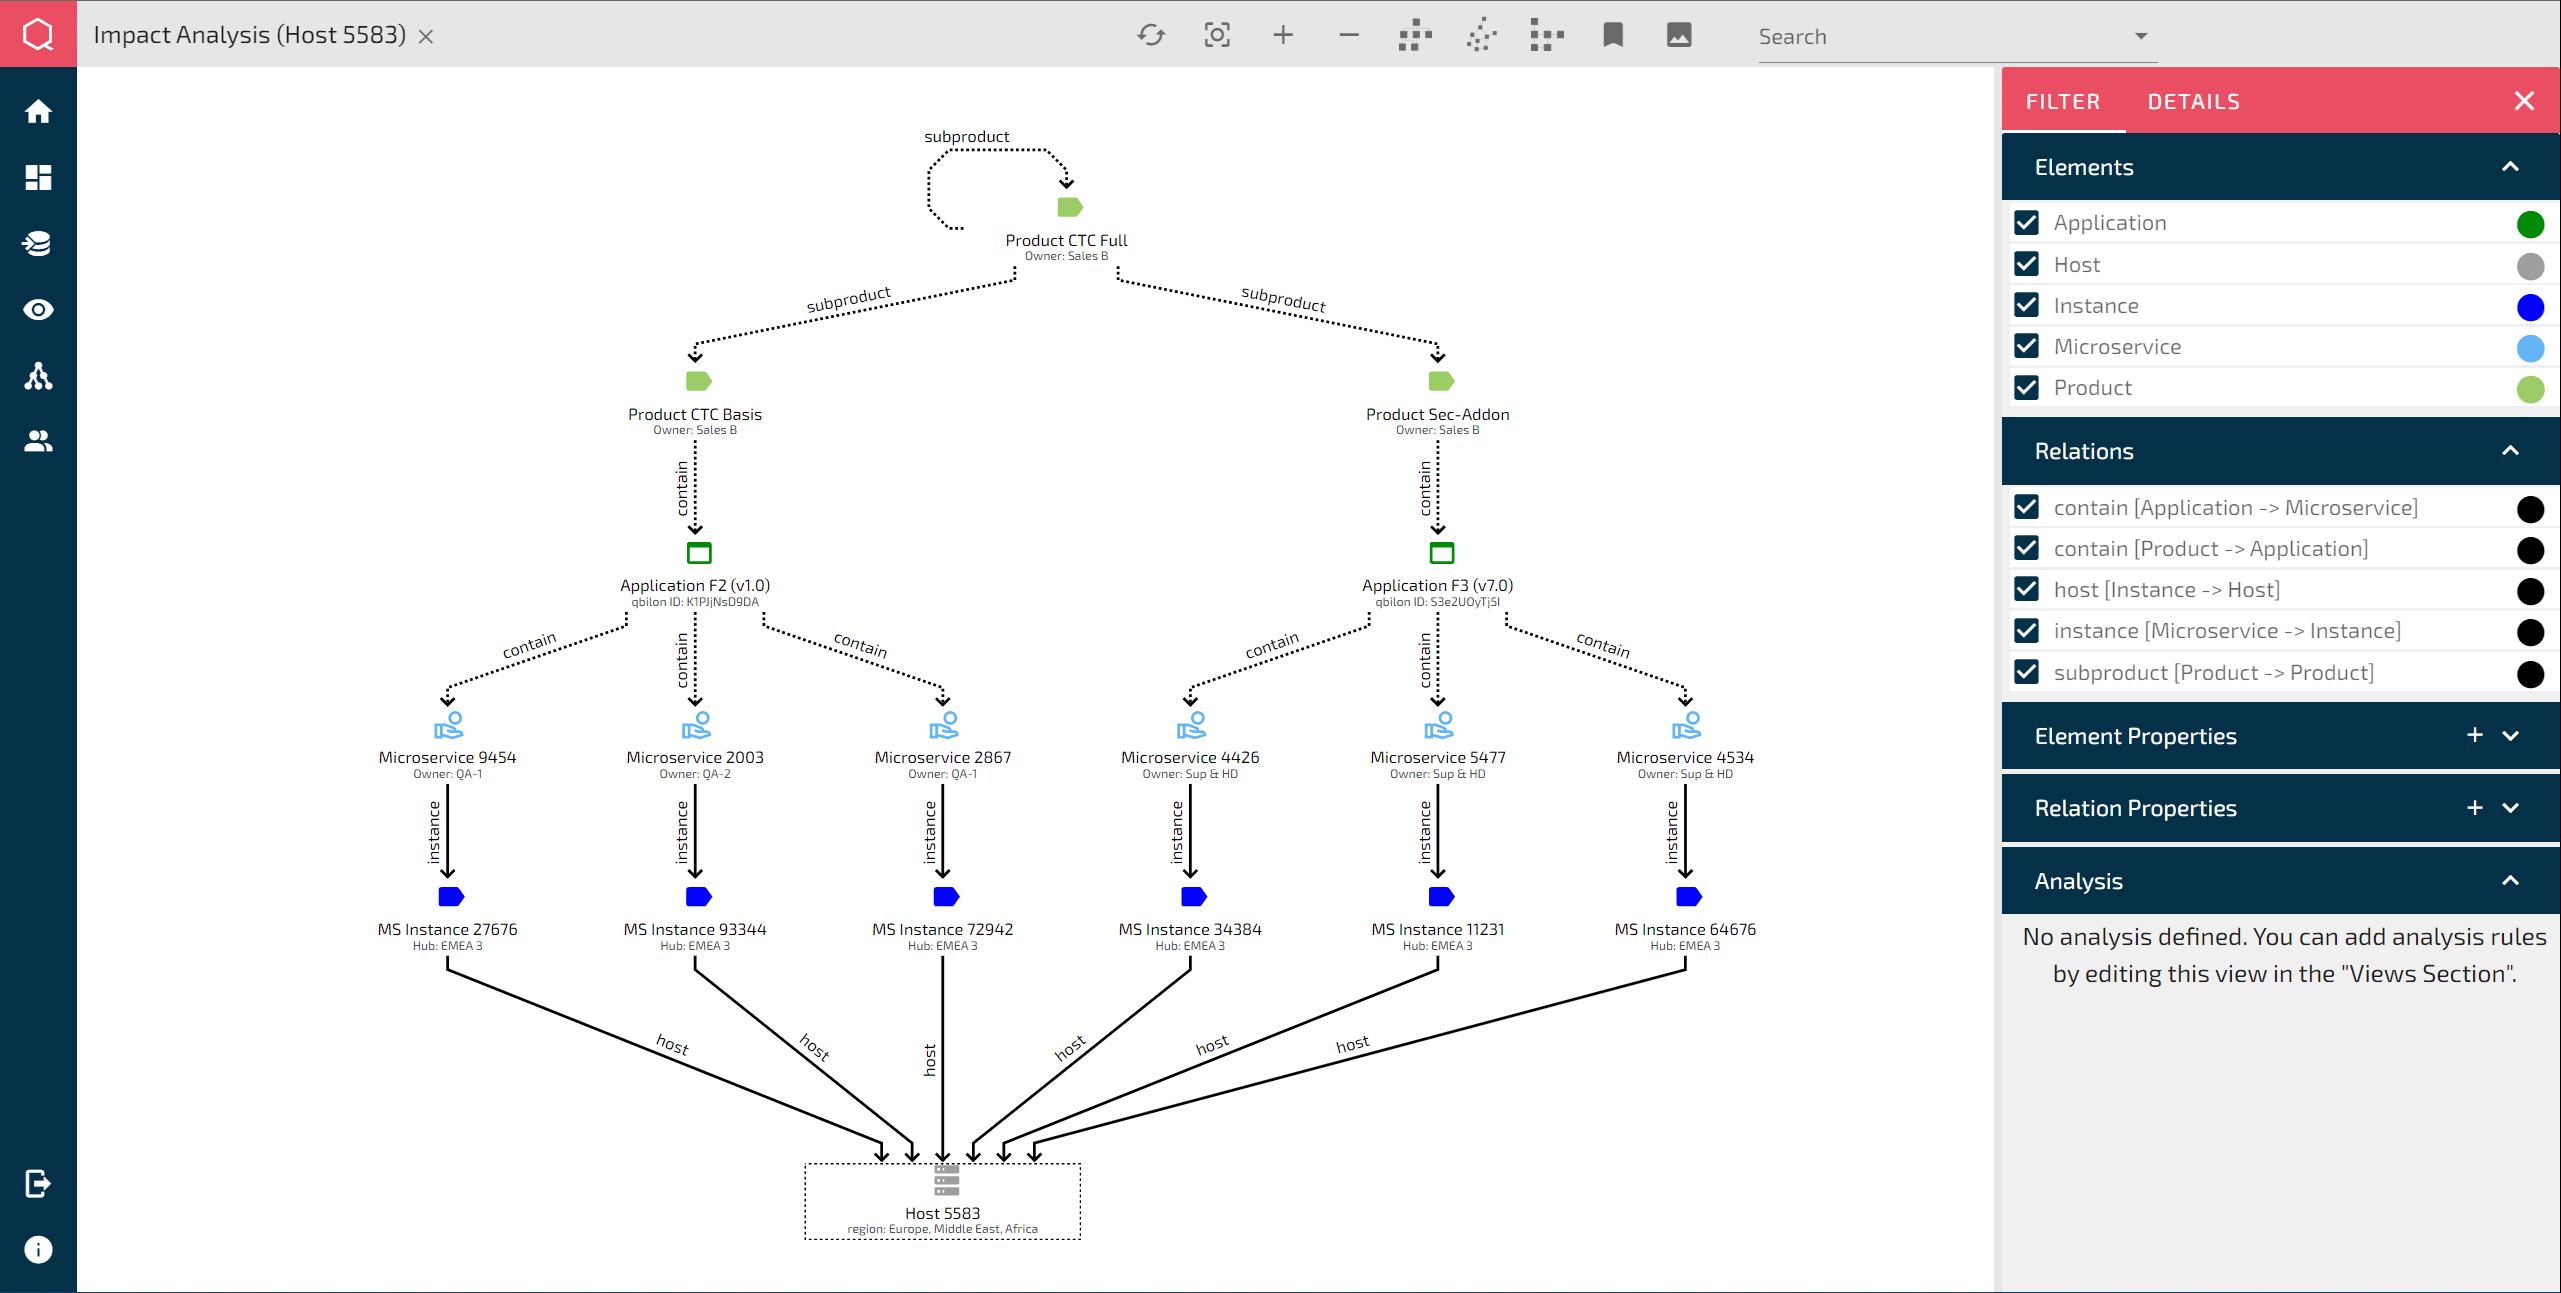
Because every IT landscape is different, qbilon employs the yFiles SDK from yWorks to offer each customer the possibility to create individual graph views for their merged data set – including features like custom filtering, searching, visual evaluation, and single-element “focus views” for impact analyses.
Needs & objectives
Needs analysis
- Quick visualization of complex and large graphs
- Highly customizable, beautiful visualization
- Ability to show dependencies and neighborhood of each node (IT asset), e.g., for impact analyses
Objectives
- Present a comprehensive overview of all IT assets and dependencies
- Support identification of security and stability issues – and offer efficient solutions
- Analyze IT spending, uncover cost drivers, and suggest alternative approaches
CIO and co-founder Julian Kienberger recalls: “At the University of Augsburg, where our founding idea was born, we used an open-source graph visualizer to create and test our software prototype.” Their goal, to create a time-saving tool that would meet the challenge of analyzing and optimizing complex IT data, led them on a search to identify the right diagramming library. They realized that their original software tool wasn’t fast or appealing enough to create a marketable product, so the developers compared alternatives – and found a perfect fit! “yFiles is much quicker at visualizing graphs and has plenty of styling features and view options”, explained Kienberger.

Why visualize?
For customers, a visual representation of their IT assets and dependencies among them is crucial for understanding, analyzing, and optimizing their IT landscapes. The IT map visualizations within qbilon are configurable, and can thus be tailored to specific customer needs. Company IT executives use them to gain an overview of complex IT landscapes, to identify bottlenecks and business-critical assets, and find indirect dependencies like two crucial – but otherwise independent – assets running on the same server.
The frontend was realized with TypeScript, the backend with Java, and a high-performance Java-in-memory database. yFiles plays a key role in one of qbilon’s main features: the representation of the merged IT data as IT assets and their dependencies within customizable and appealing graph views.

The development team of qbilon contacted the yFiles support team several times in order to implement special features. “The direct communication with yFiles developers was very pleasant and helpful for us. We had a productive exchange of ideas for both sides,” Kienberger reflects.
Test and experience yFiles free of charge!

- Free support
- Fully functional
- 100+ source-code examples
He adds that the yFiles features that are most helpful for their software are the organic, orthogonal, and hierarchic layout algorithms, and the styling options in the graph layouts. In the process of getting to know yFiles, several demos proved valuable such as the layout styles, hierarchic nesting, folding with layout, large graphs, Vue and TypeScript. The numbered demos were also helpful when first getting started creating graphs with yFiles.
Good to know
Visualizing a dependency chain for one specific host/server illustrates which other IT assets are affected if this asset is unavailable. Dependent assets may include deployed services, applications using these services, products associated with these applications, and so on.
As of August 2022, the qbilon product is market-ready and in productive use at multiple pilot customers. The software is deployed either on-premises or as software as a service (SaaS). It is continuously being upgraded using different roll-out strategies like download links and remote updates. As Kienberger shares, some leads and customers were initially concerned that the software would cause additional effort. But they quickly experienced the opposite: qbilon immediately relieves their IT staff from tedious manual data input and time-intensive maintenance, and it significantly reduces IT outages and costs.
yWorks is very pleased that yFiles is making a difference behind the scenes, and we wish qbilon all the best!
About qbilon
Based in Augsburg, qbilon GmbH is an ambitious German startup. Their software is a platform for automatically capturing, analyzing, and optimizing hybrid IT landscapes in real time – enabling companies to make well-founded, future-proof IT decisions.