Every year, the Graph Drawing conference organizes a contest which sets the task to visualize predetermined graph data. This year, the data consists of a graph that presents the relationships between 84 characters from the popular TV series ‘Game of Thrones’. Since our yFiles diagramming library is designed to arrange and visualize graph structures, we decided to participate in the contest. The image above shows a preview of our contribution. Read on if you want to find out how we created it or skip to the final result.
Getting to know the data
First, we used yFiles to quickly parse the provided GraphML file into a graph in which each node represents a character and each edge between two characters indicates a specific relationship.

Applying different yFiles layout algorithms to the graph provided insight into the overall structure of the connections. However, the data contains more information which is not depicted in these standard views:
- The full name of each character, its affiliation to a house, family, or group, and whether they are alive or deceased.
- The type of relationship; this can be a killing, an allegiance, or a family tie. In the latter case, the type further differentiates between spouses, parents, siblings, and lovers.
In addition some parts of the graph are tightly connected which surely makes it difficult to follow the paths of the connections.
Introducing structure
So how do we restructure the data such that a more structured arrangement can be achieved?
Since the story of the TV series is all about different families and groups which are competing for power, we decided
to divide the characters by their affiliation to the different houses/families.
We introduced new nodes that represent
the houses and connected every member of a house to the respective house node. Allegiances and family relationships
between members of two different houses are redirected to the house nodes to keep them from spanning across the whole graph.
Furthermore, we sized the nodes according to the number of allegiance edges to which they were incident initially.
This makes more important characters easily recognizable.
Graph layout
The next step was to actually find a good way to arrange the data. We implemented a custom layout algorithm on top ofthe available algorithms from the yFiles diagramming library.
To emphasize the affiliation of the characters to the houses, we made the algorithm place the house nodes in a circle and arrange the members of a house in the according sector.

The families get placed on concentric circles around the center of the inner circle. Children are placed further outside than their parents while we tried to set spouses and lovers on the same circle. Characters that are associated to just
one house, like servants, dragons or direwolves, are also assigned to the respective house.
There are two characters (High Sparrow, Night King) located outside the sectors because they do not belong to any house
and are only connected through a kill.
There are three types of edges: family ties, allegiances, and killings. We used different edge routing algorithms for those edges so they became easily distinguishable. Edges that describe family relations or allegiances are straight
lines when they appear inside a house sector. Inside the inner circle they get routed in arcs whose thicknesses represent
the number of edges between two houses.
Finally, the kill edges were quite a challenge. They connect characters from all parts of the diagram and there are
many of them. After some experiments, we decided that they must run outside the inner circle. They were implemented
as two straight segments and an arc. This way they can easily be distinguished from the other types of connections.
Of course, we tried to minimize the number of crossings to make it easier to follow the edges.
Styling the diagram
Creating a clear arrangement of the characters and routing the connections between them was the first important step. But a diagram where nodes are only simple, colored shapes and edges are black lines with an arc is not really an eye-catcher. Using yFiles with its many styling options we were sure it would be easy and fun to change that situation. The nodes on the inner circle carry the emblem of the house or group they represent. They mark the sector as well as the end points for the inner edges.

Characters are visualized using a picture of a person or animal along with their name. The border shows the color ofthe house to which the character belongs by birth.

Since there are three different kinds of edges, we decided to give them different colors. Edges that represent family relationships are drawn in the color of the family’s house. In case those edges connect to two house nodes, they change color in the middle. Allegiance edges are drawn using dark blue, dotted lines, independent of where the edge is located.
As previously mentioned, kill edges are routed in different style. To separate them even more from the other edges, they have a dark red color. Their direction, i.e. who killed who, is indicated by port icons. The source is marked with a bloody knife while at the target a skull is shown.
The final result
Below you find the final diagram created by our algorithm which combines all described features.
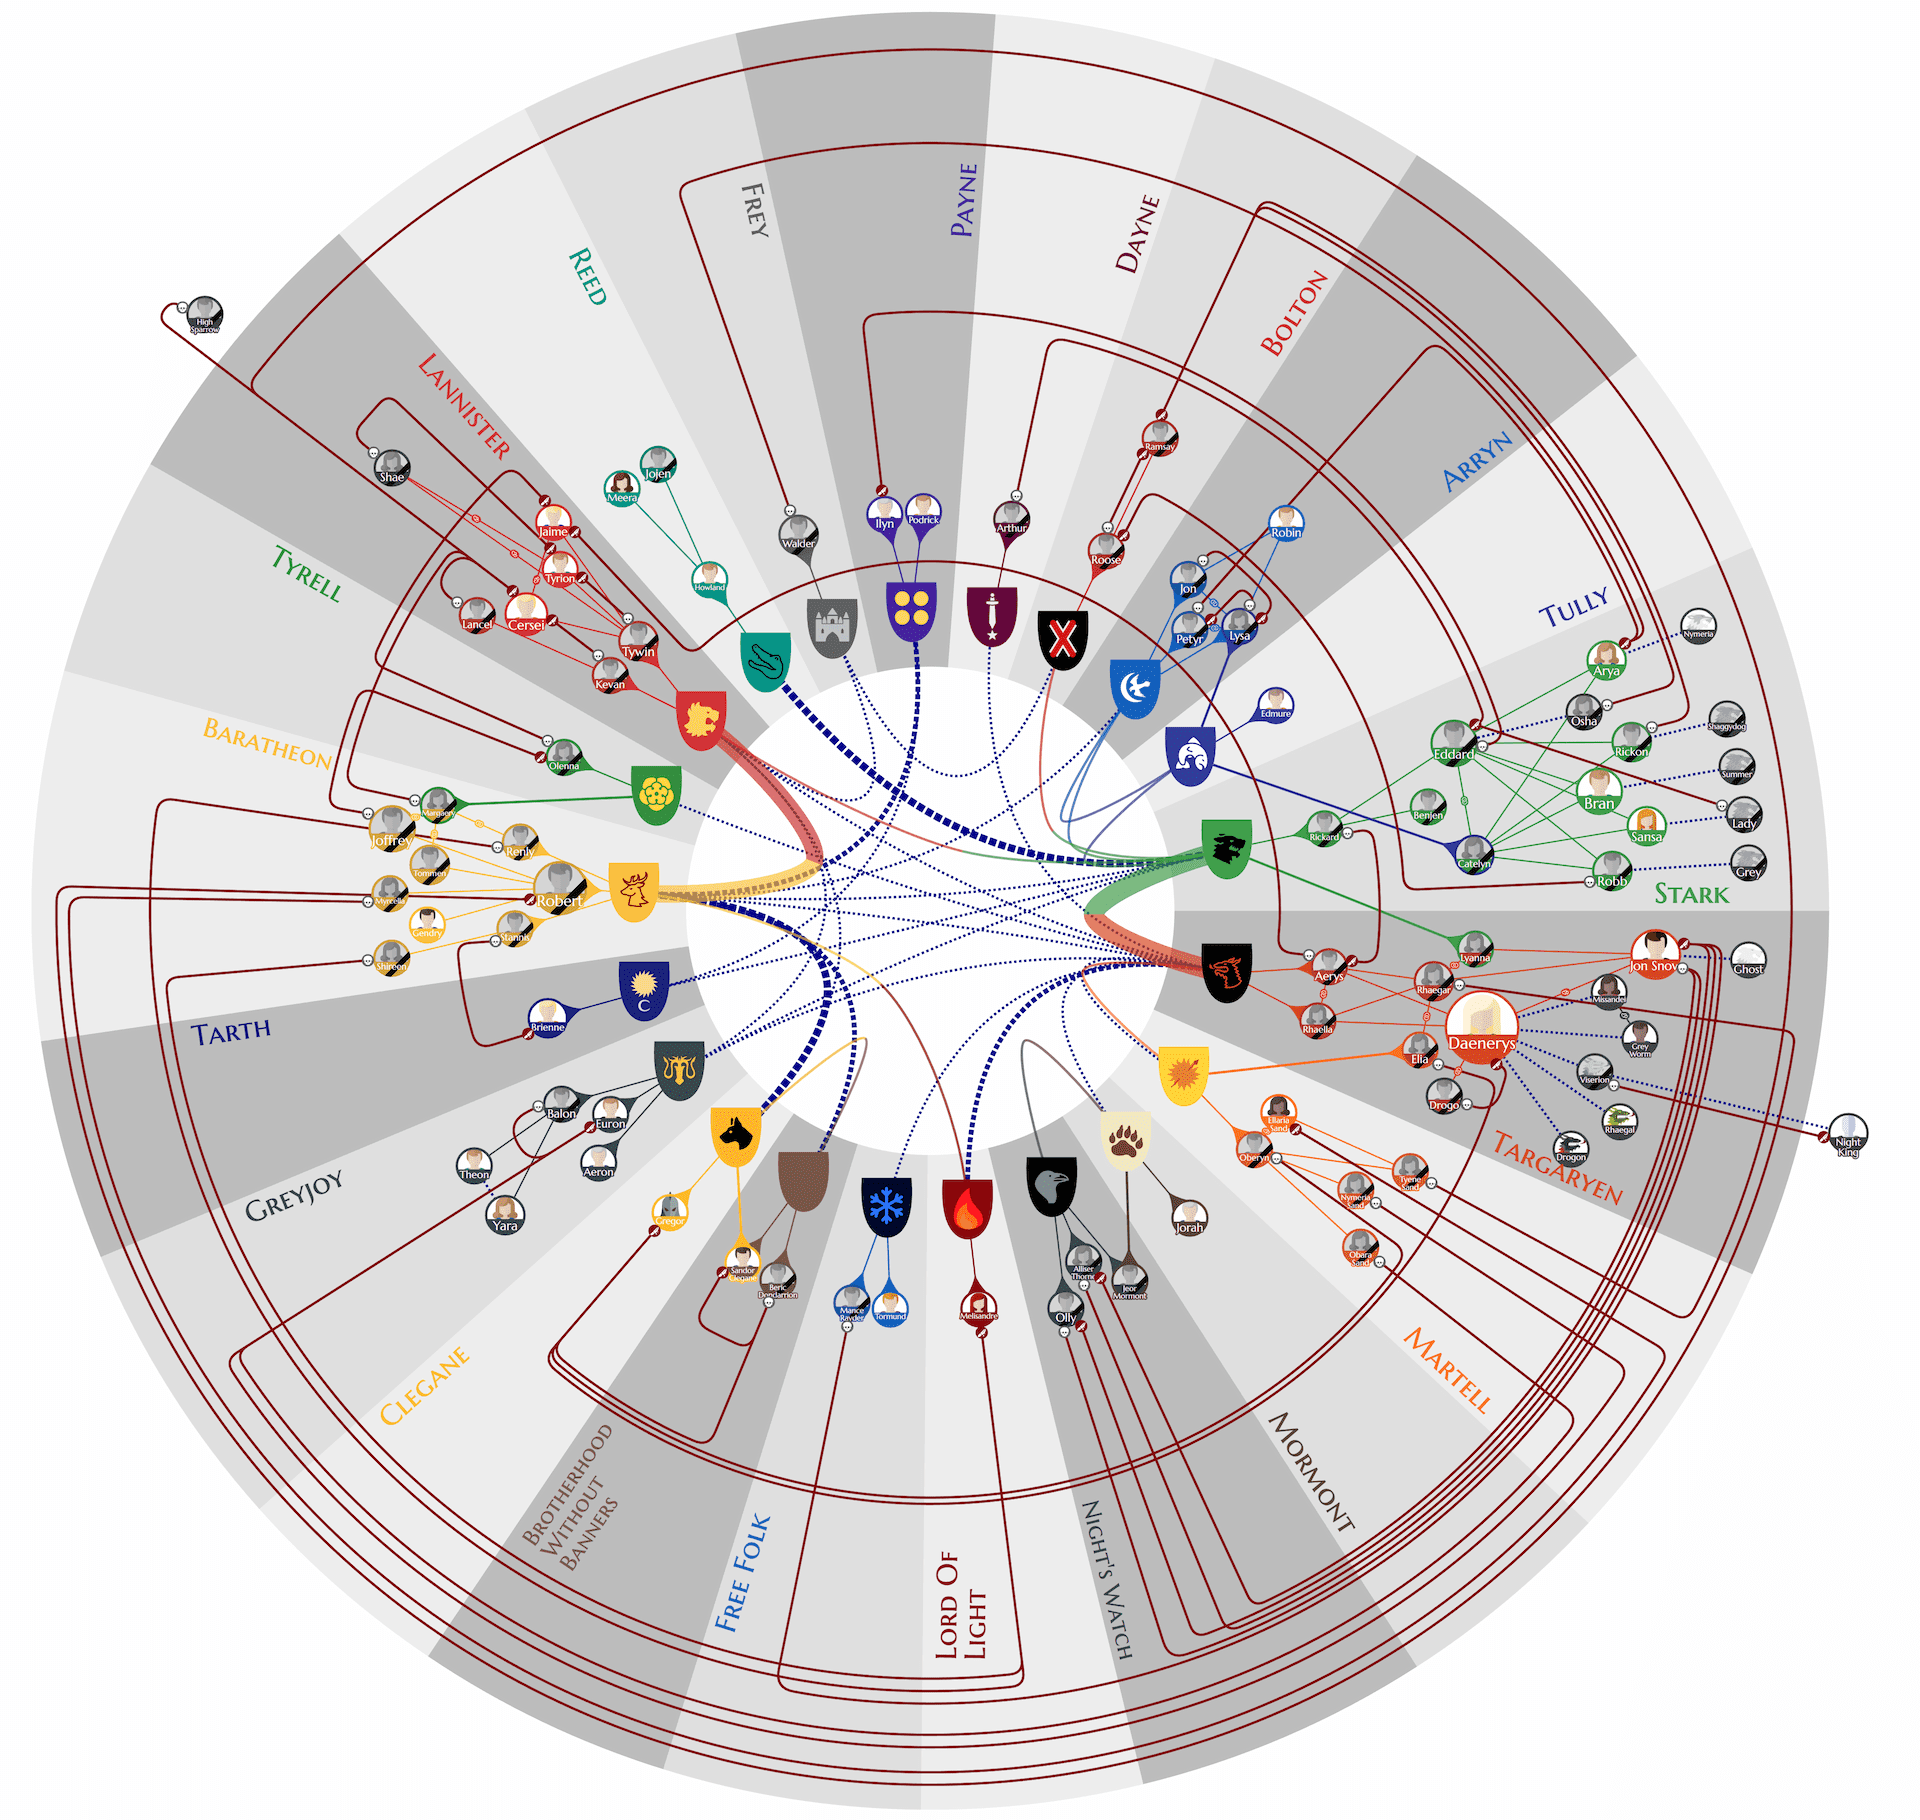
So now that we have a concise layout of the data and also a nice visualization of the diagram elements, what can we learn from the visualization?
We think that the diagram provides a lot of information at a glance. Important characters can easily be recognized
by their size and by the amount of relations they have. The large, most important houses immediately stand out.
Even though someone who is very familiar with ‘Game of Thrones’ will probably not learn something totally new, our diagram makes it very easy and efficient to get an overview over the involved groups and characters.
How do you like the results? Let us know! Just leave us a message in the social media or using our contact information.